

The stock market is up dramatically this year.
Will it continue in this Christmas season of giving?
Last Monday triggered a seasonal indicator of what some call the Santa Clause Rally. While the first part of the month typically starts out flat, it can end higher. Ryan Detrick gives us the chart1:
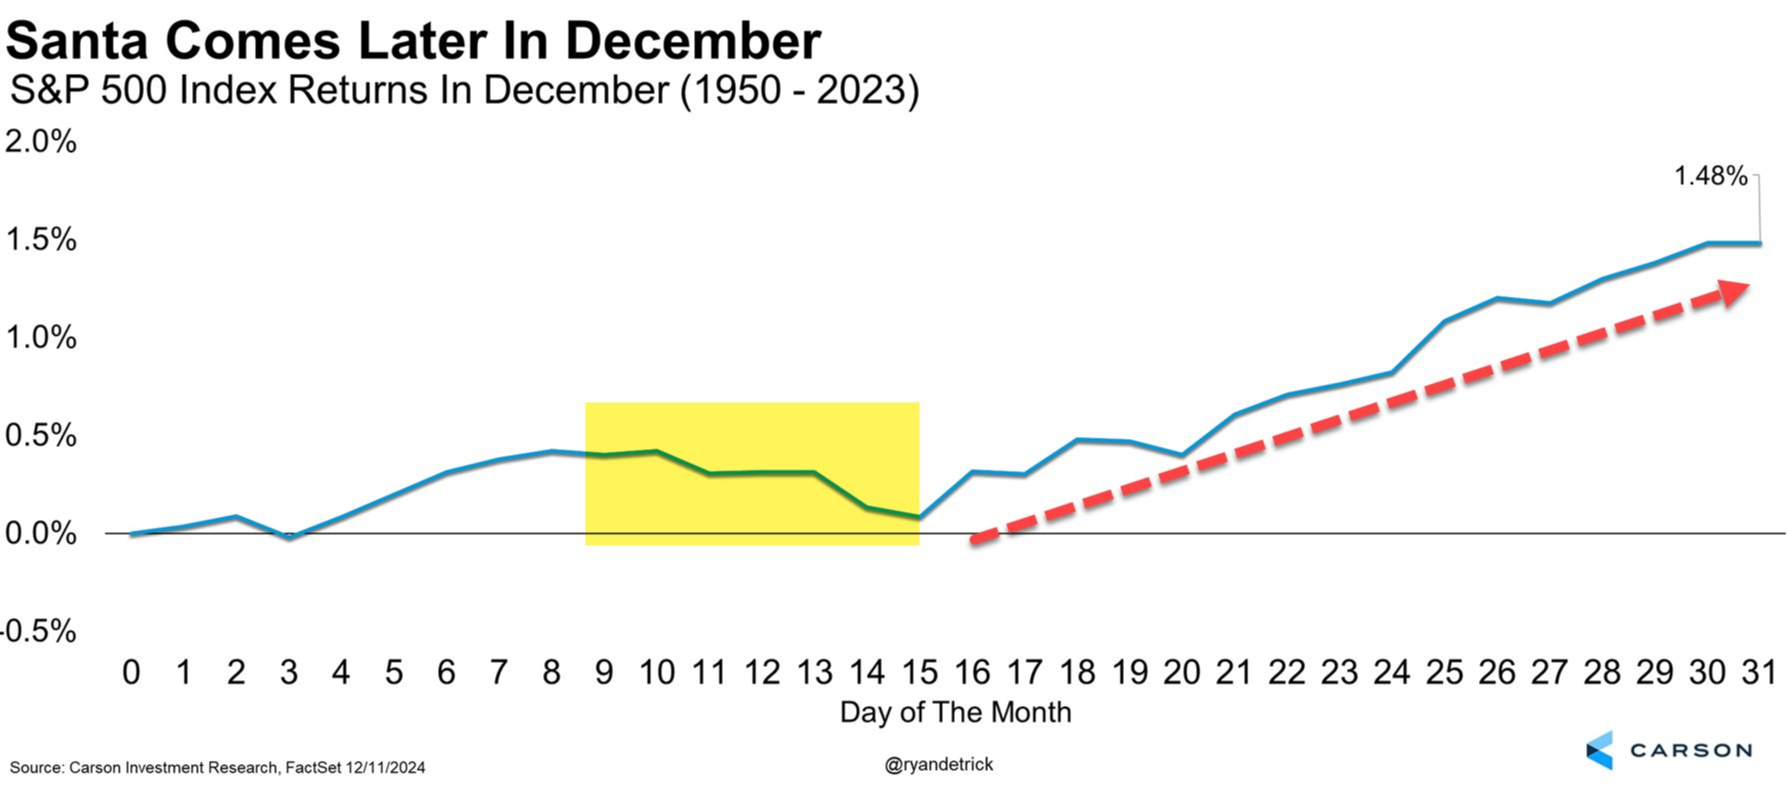
“But wait a sec,” you say. “Stocks got smashed the day of the Fed interest rate announcement last week, with the S&P 500 dropping nearly 3%.”
They did.
Indicators are not ironclad.
Though December has been positive for the S&P 500 74% of the time—more than any other month—that means 26% of the time it’s been negative.2
Is the Grinch lurking?
As of this writing Thursday morning, I don’t know how stocks performed the rest of the week.
What I do know—and what every investor must know—is that down days can happen any time of year.
According to DataTrek, in recent years this kind of a spike in volatility has been a buying opportunity:
The CBOE VIX Index spiked to its 14th highest close since the start of the current stock market in October 2022. Past instances over the last 2 years have always been good spots to buy stocks. We believe the same will prove true now.3
We shall see.
What about the longer-term impact of those kinds of drawdowns?
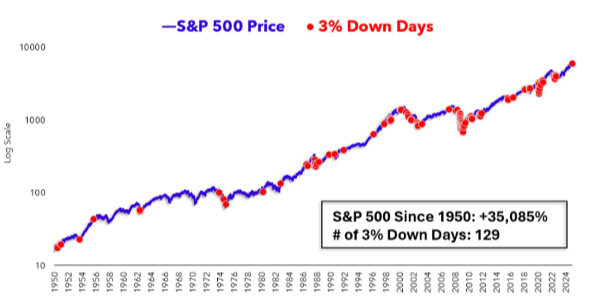
Matt Cerminaro, a Data Research Associate at Ritholtz Wealth Management, points out that -3%+ days have happened 129 times since 1950 for the S&P 500.4
And guess what?
The stock market still did well.
It’s impossible to predict how the year will end, but let’s return to some encouraging seasonality.
Eddy Elfenbein’s data shows that since 1957, one-quarter of the average annual gain of the S&P 500 takes place between December 15th and January 16th. Furthermore, about 75% of the average annual gain has occurred between October 26 and February 15th.5
’Tis the season.
One can hope.
---
Sources:
- Ryan Detrick’s chart was noted by Hamilton Lane’s Blaine Rollins in his December 17th, 2024 Weekly Research Briefing. Accessed online: https://www.hamiltonlane.com/en-us/insight/weekly-research-briefing/weekly-research-briefing-rare-air
- Charlie Bilello, The Week in Charts (12/19/24).
- Posted on X on 12/19/24. Accessed online: https://x.com/DataTrekMB/status/1869751956153225654
- LinkedIn post on December 18th, 2024. The chart below is also from this post. Accessed online: https://www.linkedin.com/posts/activity-7275260786803978240-X1LD?utm_source=share&utm_medium=member_desktop
- CWS Market Review – December 17, 2024.